pyemgpipeline.wrappers
Summary
Classes
High-level, guided processing interface with accepted EMG processing conventions |
|
Wrapper of single-trial EMG processing |
|
Wrapper of multiple-trial EMG processing |
DataProcessingManager
- class pyemgpipeline.wrappers.DataProcessingManager
High-level, guided processing interface with accepted EMG processing conventions
- Parameters
c_raw (EMGMeasurementCollection or None) – Containing data (signal, timestamp, hz, channel names, etc.) and plot parameters. c_raw accepts data from method set_data_and_params and its value won’t change when running method process_all.
c (EMGMeasurementCollection or None) – Containing data (signal, timestamp, hz, channel names, etc.) and plot parameters. When running method process_all, c gets a fresh copy of raw data from c_raw. In this way method process_all can be repeatedly executed.
dc_offset_remover (DCOffsetRemover or None) – A DCOffsetRemover processor.
bandpass_filter (BandpassFilter or None) – A BandpassFilter processor.
full_wave_rectifier (FullWaveRectifier or None) – A FullWaveRectifier processor.
linear_envelope (LinearEnvelope or None) – A LinearEnvelope processor.
end_frame_cutter (EndFrameCutter or None) – An EndFrameCutter processor.
amplitude_normalizer (AmplitudeNormalizer or None) – An AmplitudeNormalizer processor.
segmenter (Segmenter or None) – A Segmenter processor.
segmenter_all_beg_ts (list or None) – Beginning time of interest for each trial to segment. See function apply_segmenter of class EMGMeasurementCollection.
segmenter_all_end_ts (list or None) – End time of interest for each trial to segment. See function apply_segmenter of class EMGMeasurementCollection.
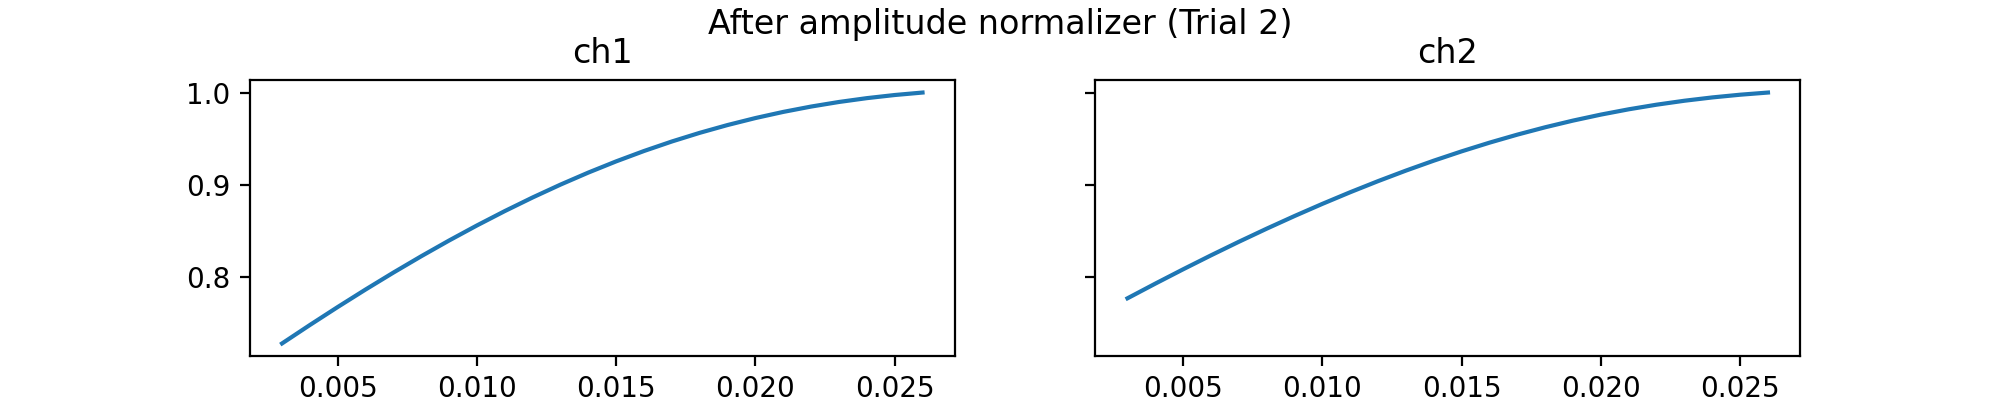
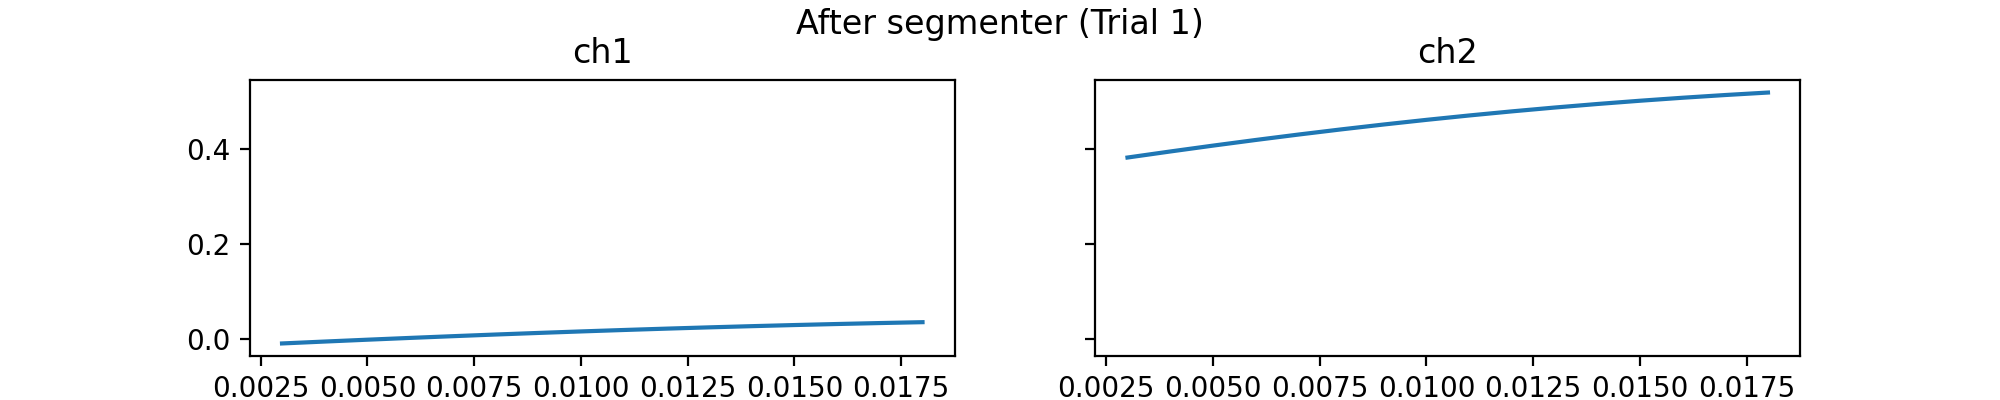
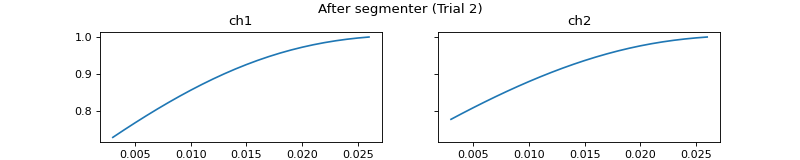
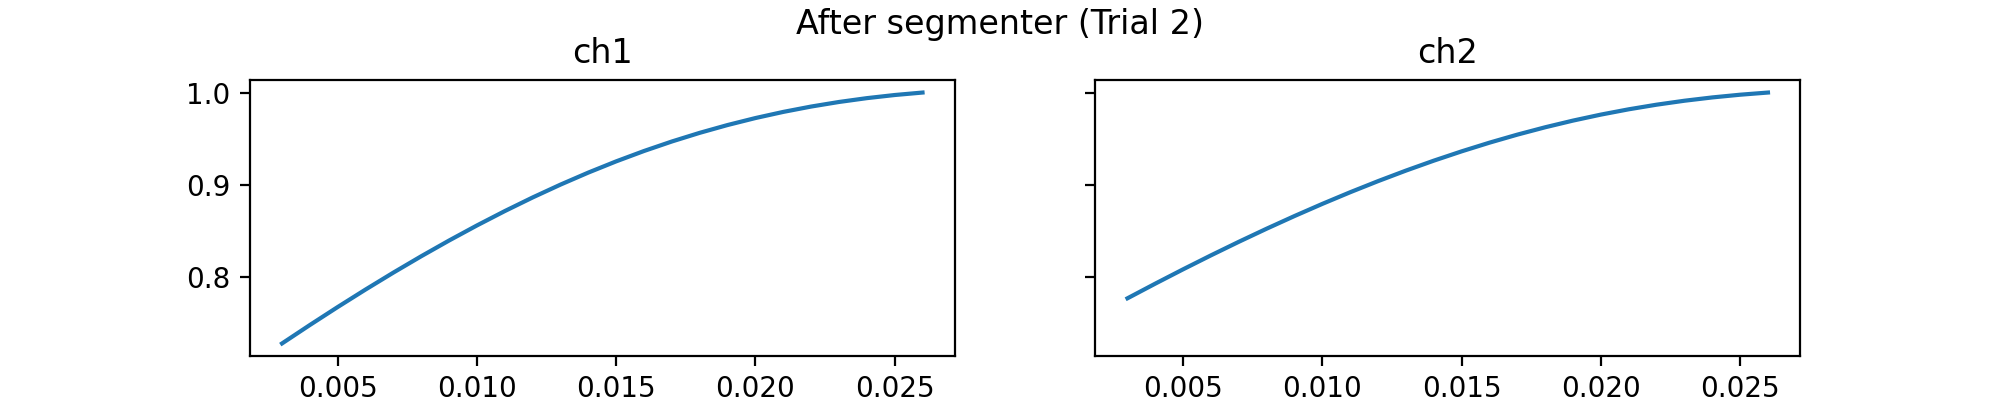
- process_all(is_plot_processing_chain=False, k_for_plot=None, is_overlapping_trials=False, cycled_colors=None, is_hide_legend=False, legend_kwargs=None, axes_pos_adjust=None)
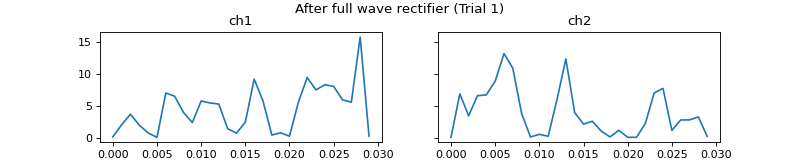
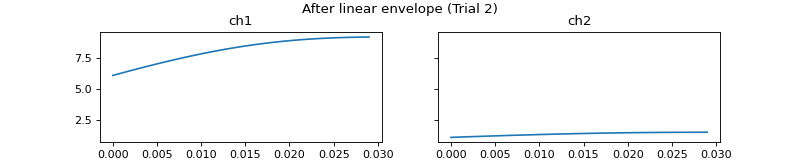
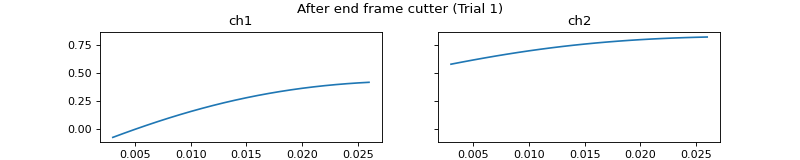
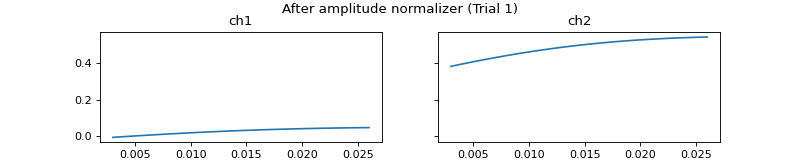
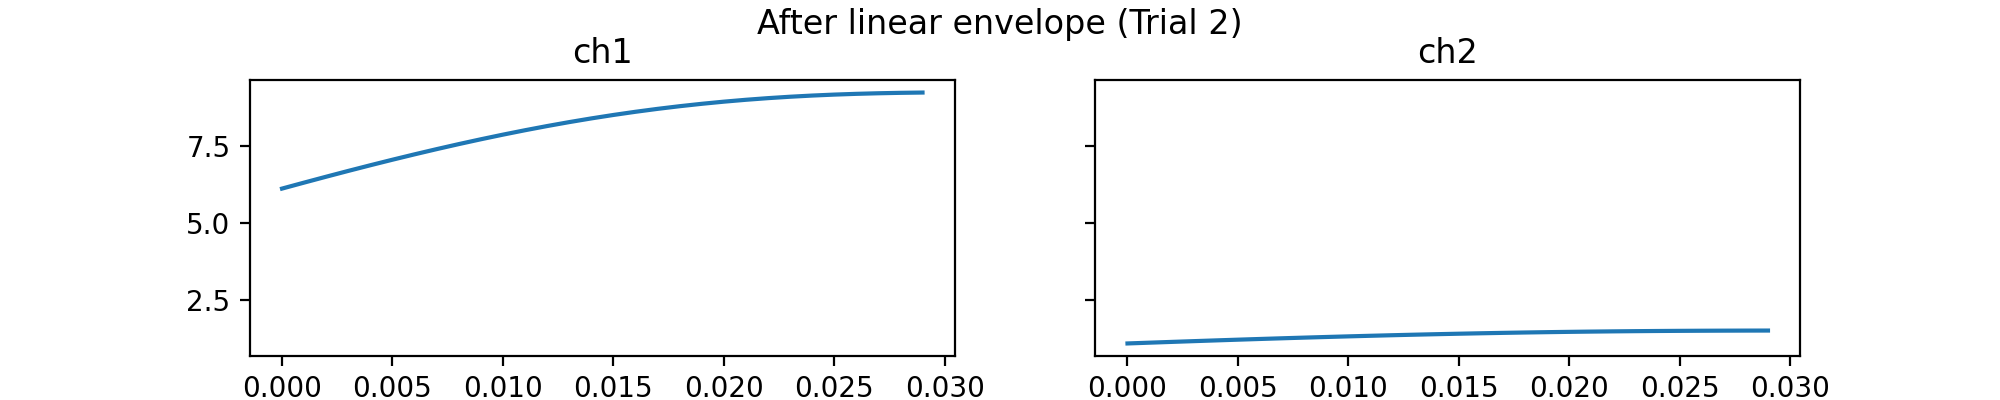
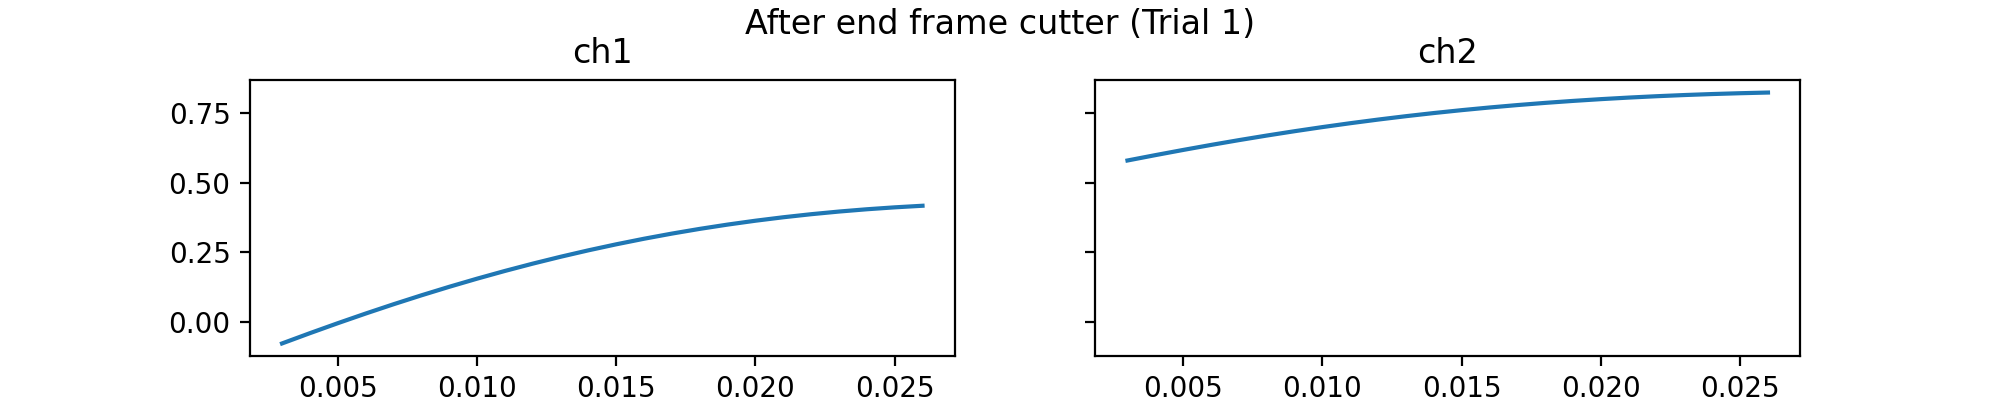
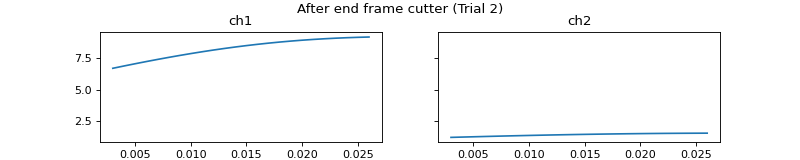
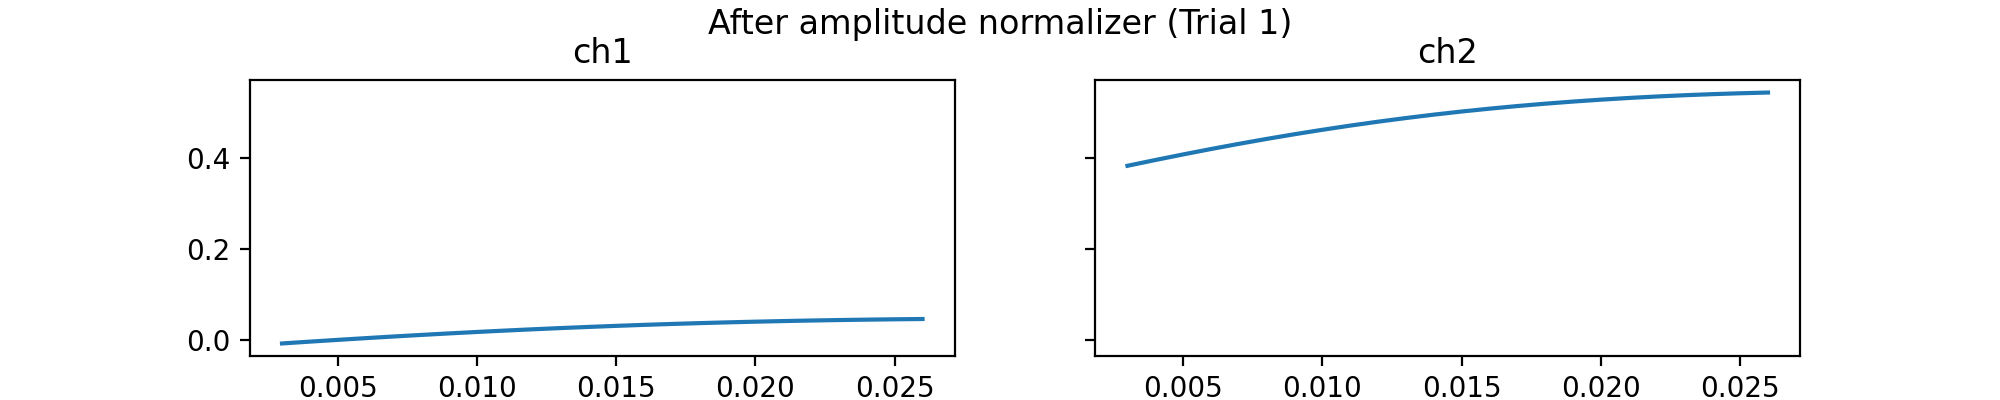
Apply current processors to data and plot intermediate results
- Parameters
is_plot_processing_chain (bool) – Whether to plot the intermediate results after each processing step.
k_for_plot (integer, list of integer, or None) – If integer, k_for_plot is an index of the list self.c.all_data. If list of integer, k_for_plot is a list of selected indices of the list self.c.all_data. If None, k_for_plot will be a list of all indices of the list self.c.all_data. k_for_plot sets which trials of the data to be plotted.
is_overlapping_trials (bool, default False) – Whether or not to plot trials of the same channel overlappingly on one (sub)figure.
cycled_colors (list or None, default None) – cycled_colors is used when is_overlapping_trials is True. The colors for plotting overlapped trials data.
is_hide_legend (bool, default False) – Whether or not to hide legend.
legend_kwargs (dict or None, default None) – legend_kwargs is used when is_overlapping_trials is True. Parameters to control the legend display. They are the “other parameters” of method matplotlib.axes.Axes.legend, including loc, bbox_to_anchor, ncol, prop, fontsize, etc. (See https://matplotlib.org/stable/api/_as_gen/matplotlib.axes.Axes.legend.html).
axes_pos_adjust (4-tuple or None, default None) – axes_pos_adjust is used when is_overlapping_trials is True. Parameters to adjust the axes position (i.e., plot position) when legend is displayed to prevent legend overlaying the plot. The 4-tuple represents: [0] shift of left position relative to width, [1] shift of bottom position relative to height, [2] proportion of width, [3] proportion of height. If None, no adjustment is applied, i.e., the value (0, 0, 1, 1) is applied.
- Returns
c – An EMGMeasurementCollection instance which saves the processed data.
- Return type
- set_amplitude_normalizer(amplitude_normalizer)
Set amplitude normalizer
- Parameters
amplitude_normalizer (AmplitudeNormalizer) – A amplitude normalizer.
- Returns
- Return type
None
- set_bandpass_filter(bandpass_filter)
Set bandpass filter
- Parameters
bandpass_filter (BandpassFilter) – A bandpass filter.
- Returns
- Return type
None
- set_data_and_params(all_data, hz, all_timestamp=None, trial_names=None, channel_names=None, emg_plot_params=None)
Set the data and plot parameters and initialize default processors
- Parameters
all_data (list) – Elements of all_data are signal data of the trials. Signal data of each trial should be ndarray of shape (n_samples,) or (n_samples, n_channels), where n_samples > 15. Dimensions and n_channels (if 2-dim) of all trials should be the same.
hz (float) – Sample rate in hertz.
all_timestamp (list or None, default None) – If list, its length should be the same as the length of all_data and elements are ndarray or None. The ndarray in all_timestamp is the actual timestamp of the corresponding trial, and it should be in 1-dim and have the same length as the first dimension of its corresponding element in all_data.
trial_names (list or None, default None) – Trial names. If not None, trial_names and all_data should have the same length.
channel_names (list or None, default None) – If list, elements are str and its length should be equal to n_channels. Channel names of all trials to be shown in plots.
emg_plot_params (EMGPlotParams or None, default None) – See class EMGPlotParams and function emg_plot.
- set_dc_offset_remover(dc_offset_remover)
Set DC offset remover
- Parameters
dc_offset_remover (DCOffsetRemover) – A DC offset remover.
- Returns
- Return type
None
- set_end_frame_cutter(end_frame_cutter)
Set end frame cutter
- Parameters
end_frame_cutter (EndFrameCutter) – A end frame cutter.
- Returns
- Return type
None
- set_full_wave_rectifier(full_wave_rectifier)
Set full wave rectifier
- Parameters
full_wave_rectifier (FullWaveRectifier) – A full wave rectifier.
- Returns
- Return type
None
- set_linear_envelope(linear_envelope)
Set linear envelope
- Parameters
linear_envelope (LinearEnvelope) – A linear envelope.
- Returns
- Return type
None
- set_segmenter(segmenter, all_beg_ts, all_end_ts)
Set segmenter and beginning/end time of interest
- Parameters
segmenter (Segmenter) – A segmenter.
all_beg_ts (list) – Beginning time of interest for each trial. See function apply_segmenter of class EMGMeasurementCollection.
all_end_ts (list) – End time of interest for each trial. See function apply_segmenter of class EMGMeasurementCollection.
- Returns
- Return type
None
Show current processes and related parameter values
- Returns
- Return type
None
Example
import numpy as np
from matplotlib.figure import SubplotParams
import pyemgpipeline as pep
# prepare data # 2 trials # 2 channel in each trial, shape = (30, 2)
all_data = [
np.array([[8.698, -9.613], [7.172, -2.594], [3.51, -5.951], [8.087, -2.899], [5.035, -2.289],
[10.529, -0.763], [-2.289, 4.73], [4.12, 1.068], [0.153, -4.12], [12.665, -9.918],
[9.613, -7.782], [15.106, -9.918], [9.003, -12.665], [7.477, -22.43], [2.899, -10.223],
[5.646, -11.749], [-5.646, -8.698], [1.373, -9.918], [3.204, -5.951], [6.866, -6.866],
[3.51, -5.951], [10.529, -7.172], [13.275, -8.087], [11.444, -13.275], [12.054, -13.275],
[11.139, -6.561], [9.308, -7.782], [8.087, -7.477], [18.463, -1.068], [1.984, -4.12]]),
np.array([[-14.801, -12.97], [-21.21, -10.834], [-27.313, 7.477], [-42.878, -5.646], [-42.573, -5.646],
[-35.859, -9.613], [-42.268, -10.834], [-23.041, -10.529], [-16.022, -9.613], [-12.97, -11.749],
[-9.613, -12.665], [-22.125, -16.937], [-23.346, -11.749], [-42.268, -8.087], [-53.864, -9.613],
[-41.047, -7.477], [-27.924, -16.632], [-28.839, -8.698], [-19.684, -8.392], [-17.242, -4.73],
[6.866, -8.698], [37.995, 3.204], [78.279, -3.815], [102.694, -3.204], [132.296, -9.003],
[141.756, -9.308], [113.375, -4.12], [102.388, -12.97], [86.823, -6.866], [78.584, -15.717]])]
hz = 1000
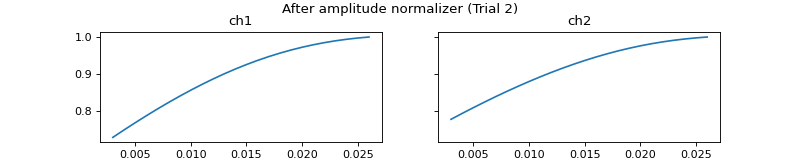
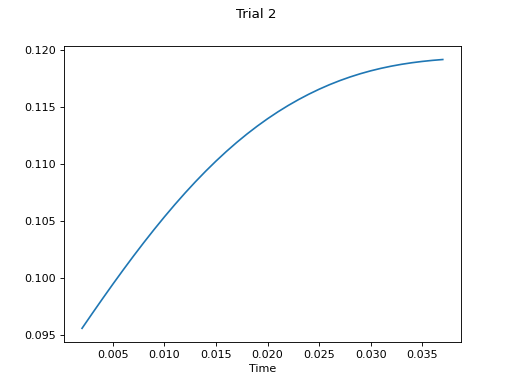
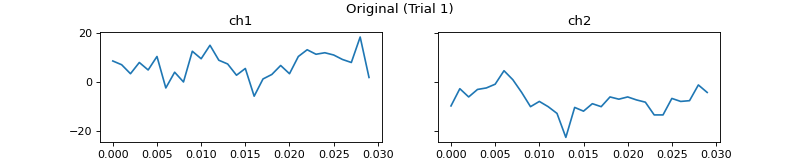
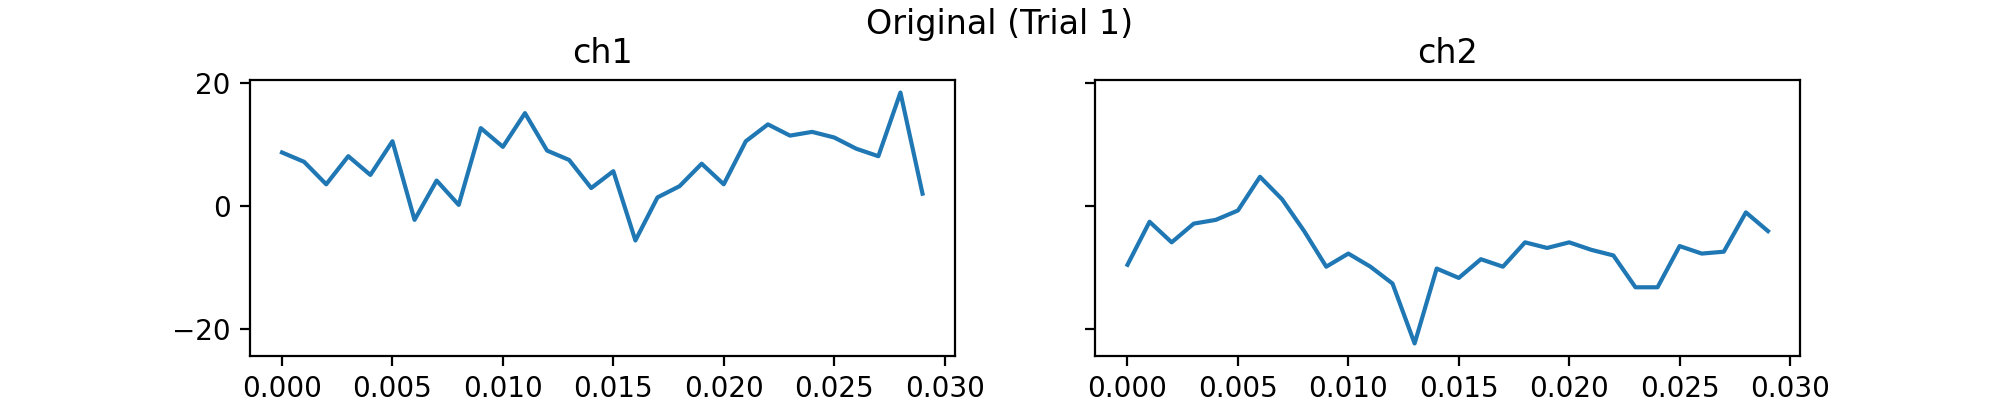
# initialize DataProcessingManager
mgr = pep.wrappers.DataProcessingManager()
# set data, parameters, and processors
mgr.set_data_and_params(all_data, hz=hz, trial_names=['Trial 1', 'Trial 2'], channel_names=['ch1', 'ch2'],
emg_plot_params=pep.plots.EMGPlotParams(
n_cols=2,
fig_kwargs={'figsize': (10, 2), 'subplotpars': SubplotParams(top=0.8)}))
mgr.set_end_frame_cutter(pep.processors.EndFrameCutter(n_end_frames=3))
mgr.set_amplitude_normalizer(pep.processors.AmplitudeNormalizer())
mgr.set_segmenter(pep.processors.Segmenter(),
all_beg_ts=[0,0],
all_end_ts=[0.018, 999])
mgr.show_current_processes_and_related_params()
# apply processing steps
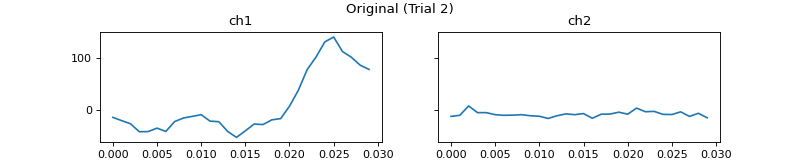
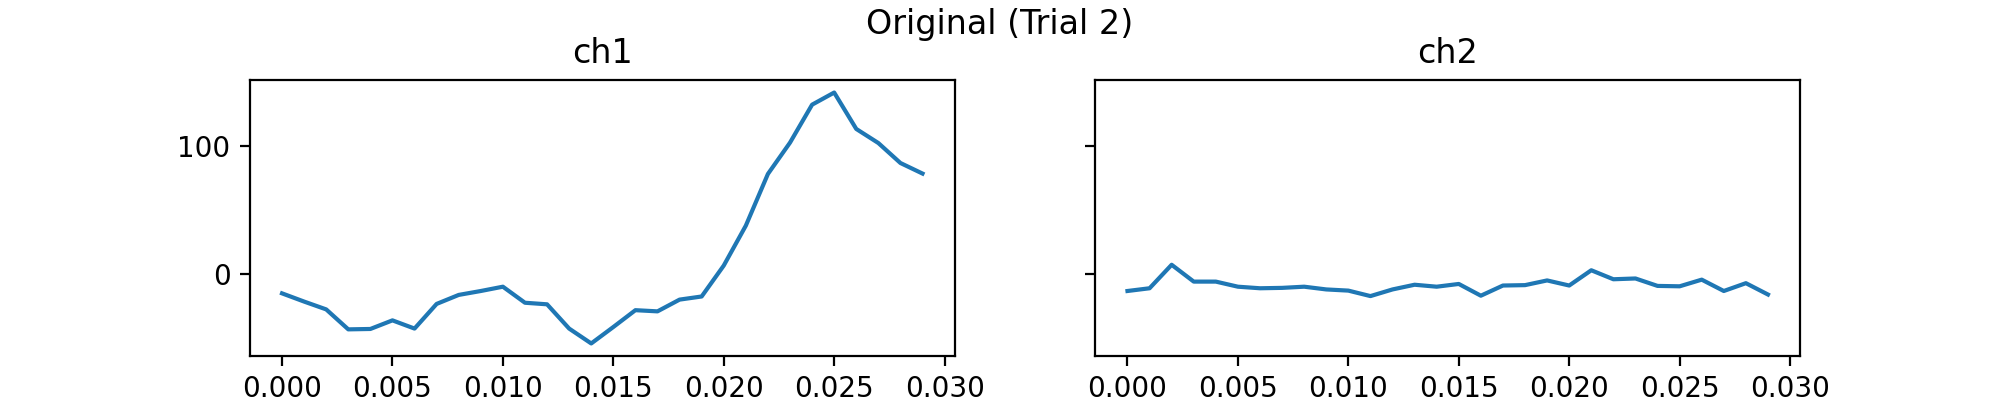
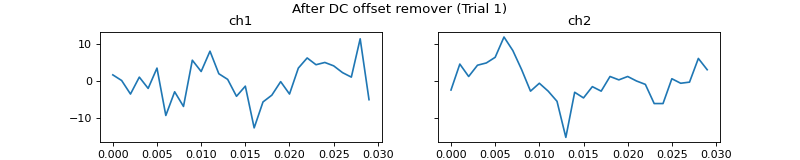
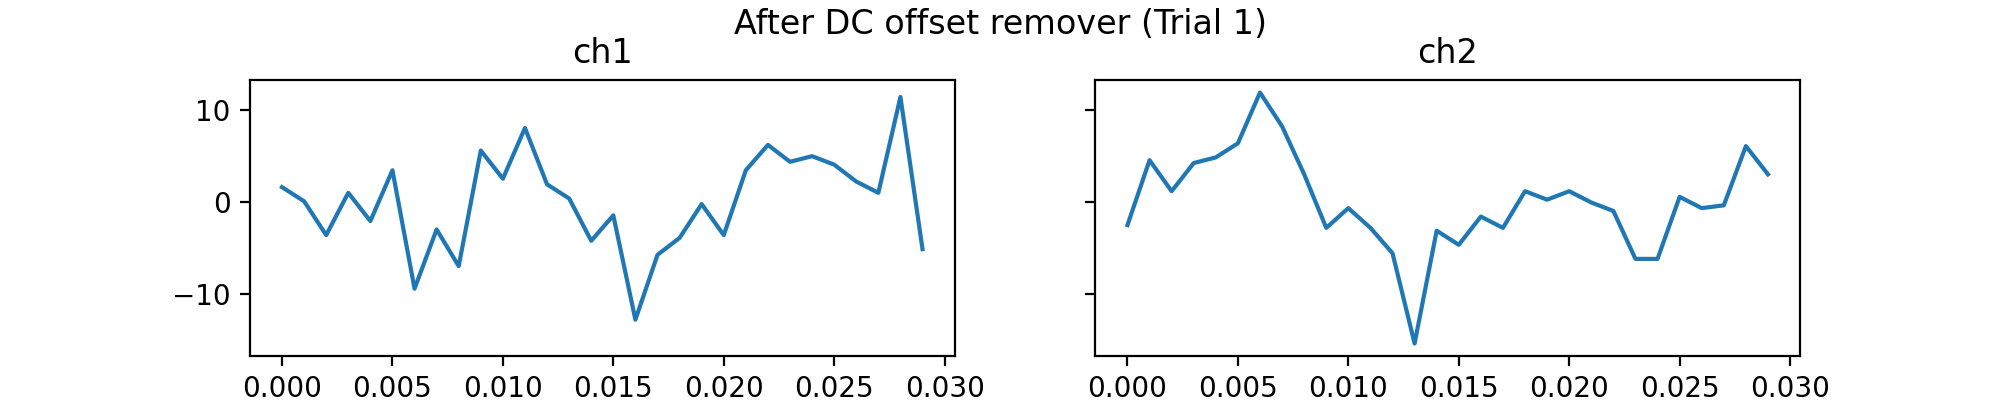
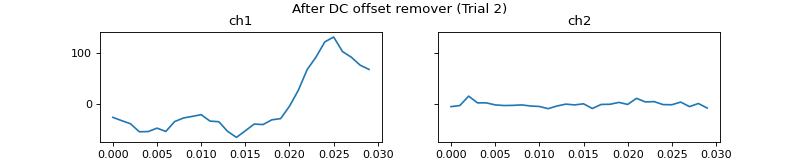
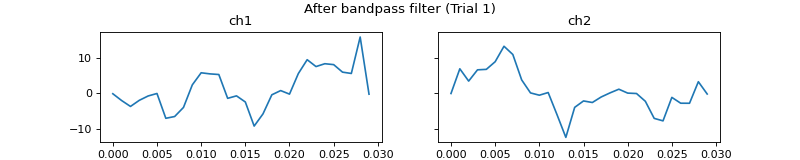
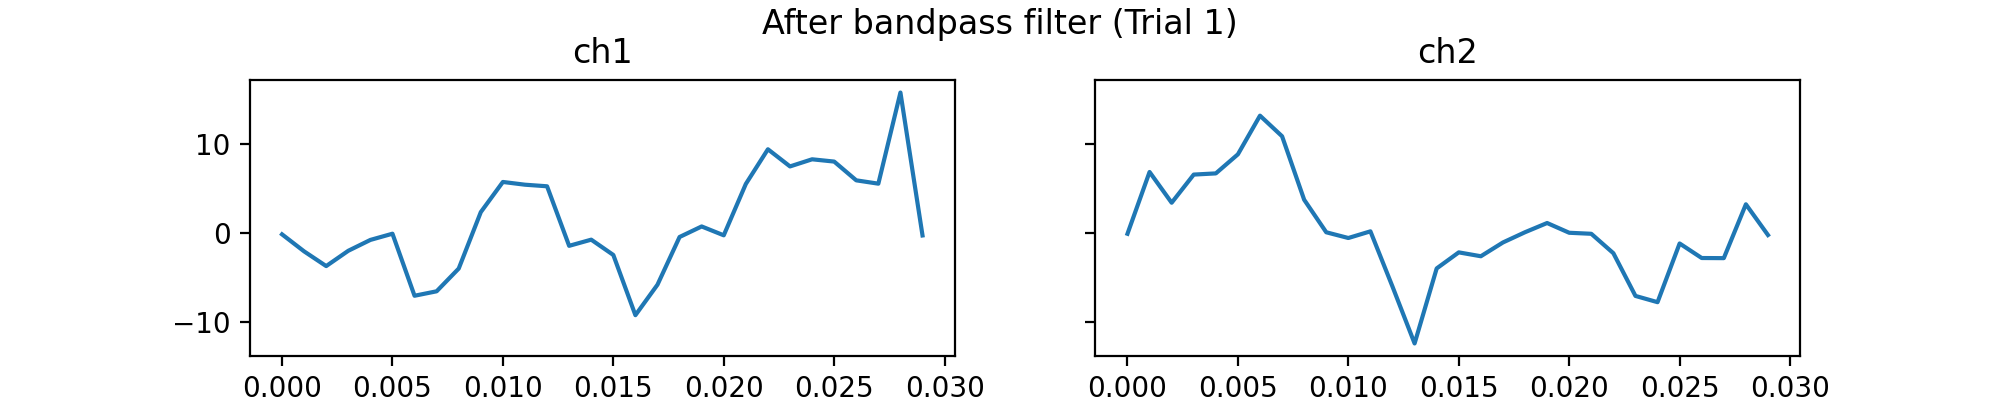
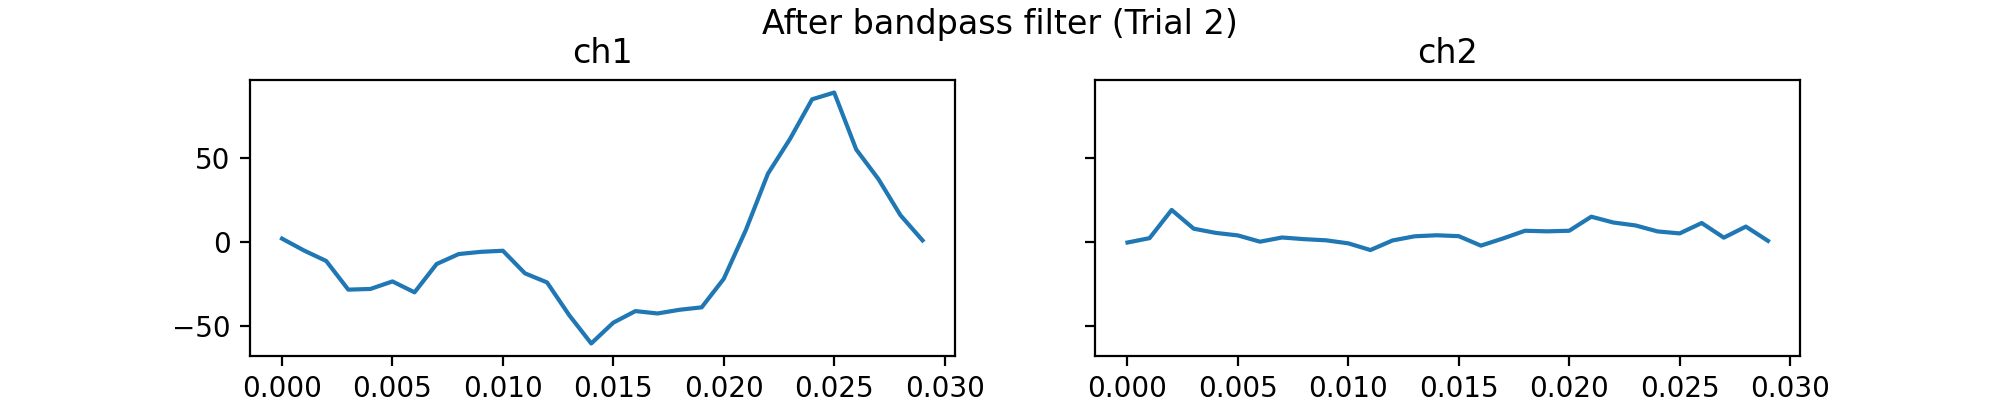
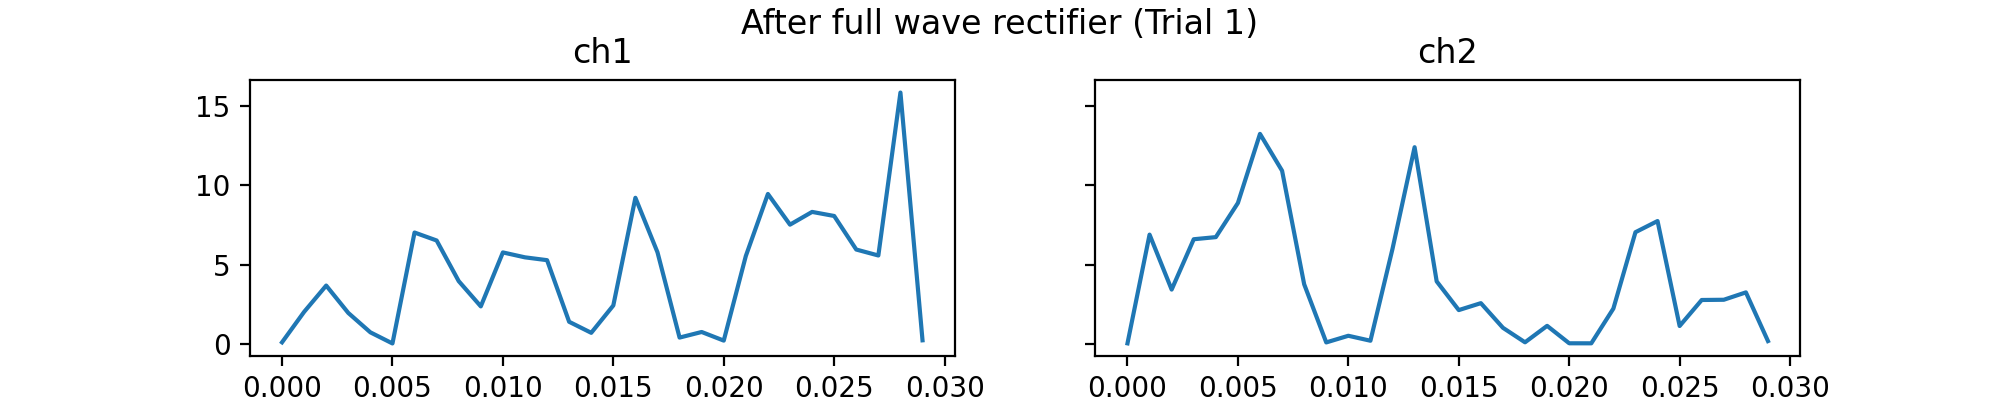
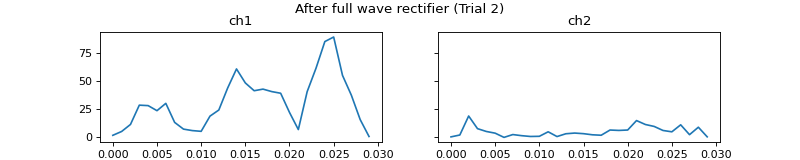
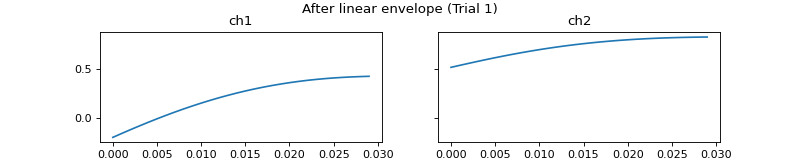
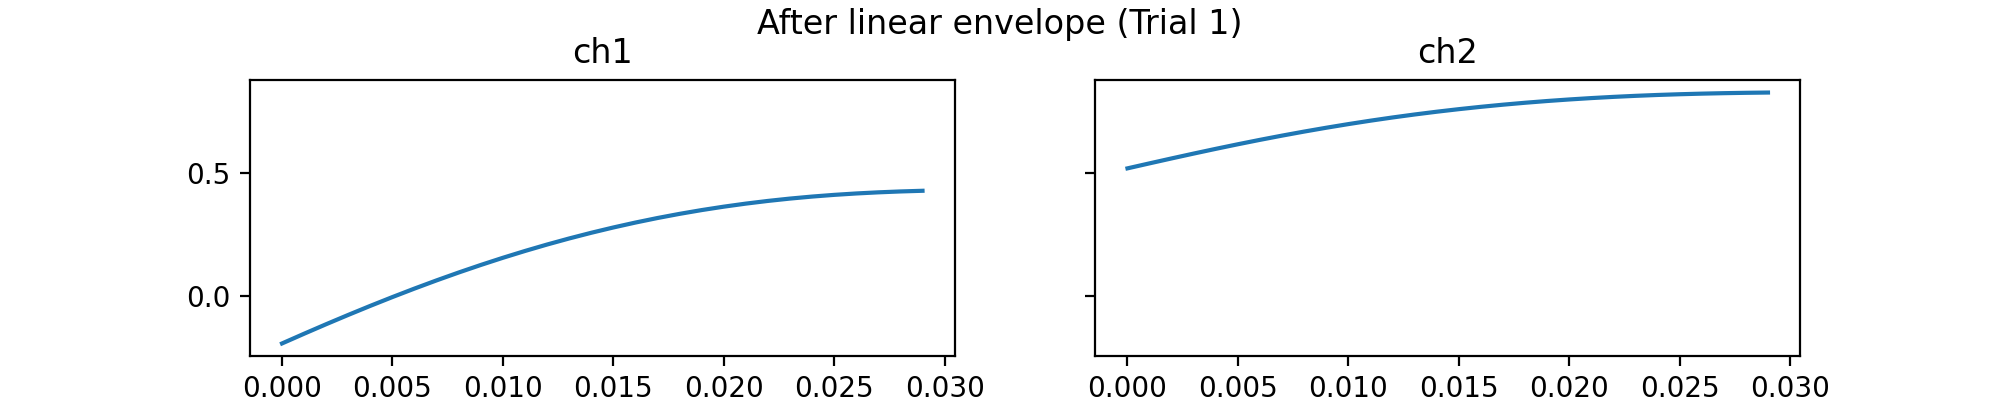
c = mgr.process_all(is_plot_processing_chain=True)


EMGMeasurement
- class pyemgpipeline.wrappers.EMGMeasurement(data, hz, timestamp=None, trial_name=None, channel_names=None, emg_plot_params=None)
Wrapper of single-trial EMG processing
- Parameters
data (ndarray of shape (n_samples,) or (n_samples, n_channels),) – where n_samples > 15 (See Notes) Signal data of one trial.
hz (float) – Sample rate in hertz. See class EMGMeasurementCollection for suggested values of hz.
timestamp (ndarray or None, default None) – The actual timestamp corresponds to the signal. If it is an ndarray, it should be in 1-dim and have the same length as the first dimension of x.
trial_name (str or None, default None) – Trial name.
channel_names (list of str, or None, default None) – If list, its length should be equal to n_channels. Channel names to be shown in the plot.
emg_plot_params (EMGPlotParams, default None) – Parameters to control the plot. See class EMGPlotParams and function emg_plot.
Notes
n_samples has to meet the length condition for using bandpass filter. With the default parameter in BandpassFilter, n_samples must exceed 15. (See class BandpassFilter, function apply)
- apply_amplitude_normalizer(max_amplitude)
Apply amplitude normalizer to the data
- Parameters
max_amplitude (scalar, list, or ndarray) – One or more positive values. If data is in 1-dim or n_channels is 1, then max_amplitude should be one value; otherwise max_amplitude should be n_channels values. max_amplitude is the value used as divisor in amplitude normalization.
- Returns
- Return type
None
- apply_bandpass_filter(bf_order=4, bf_cutoff_fq_lo=10, bf_cutoff_fq_hi=450)
Apply bandpass filter to the data
- Parameters
bf_order (int, default=4) – Effective order (i.e., order after two-directional filtering) of the butterworth filter. bf_order should be a multiple of 2.
bf_cutoff_fq_lo (float, default=10) – Low cutoff frequency of the bandpass filter. See class BandpassFilter.
bf_cutoff_fq_hi (float, default=450) – High cutoff frequency of the bandpass filter. See class BandpassFilter.
- Returns
- Return type
None
- apply_dc_offset_remover()
Apply DC offset remover to the data
- Returns
- Return type
None
- apply_end_frame_cutter(n_end_frames=30)
Apply end frame cutter to the data (signal and timestamp)
- Parameters
n_end_frames (int, default=30) – Number of frames to be cut off in both ends of the signal. n_end_frames >= 0.
- Returns
- Return type
None
- apply_full_wave_rectifier()
Apply full wave rectifier to the data
- Returns
- Return type
None
- apply_linear_envelope(le_order=4, le_cutoff_fq=6)
Apply linear envelope to the data
- Parameters
le_order (int, default=4) – Effective order (i.e., order after two-directional filtering) of the butterworth filter for linear envelope. le_order should be a multiple of 2.
le_cutoff_fq (float, default=6) – Cutoff frequency of the lowpass filter. See class LinearEnvelope.
- Returns
- Return type
None
- apply_segmenter(beg_ts, end_ts)
Apply segmenter to the data (signal and timestamp)
- Parameters
beg_ts (float) – Beginning time of interest. beg_ts <= timestamp[-1].
end_ts (float) – End time of interest. end_ts >= timestamp[0]. Also beg_ts < end_ts.
- Returns
- Return type
None
- export_csv(csv_path)
Export the processing result to csv
- Parameters
csv_path (str) – The destination path to export data.
- Returns
- Return type
None
- plot()
Plot the data
- Returns
- Return type
None
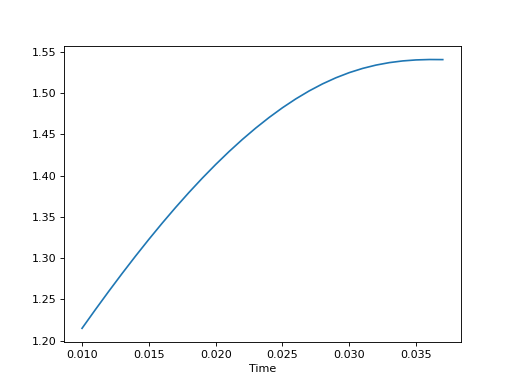
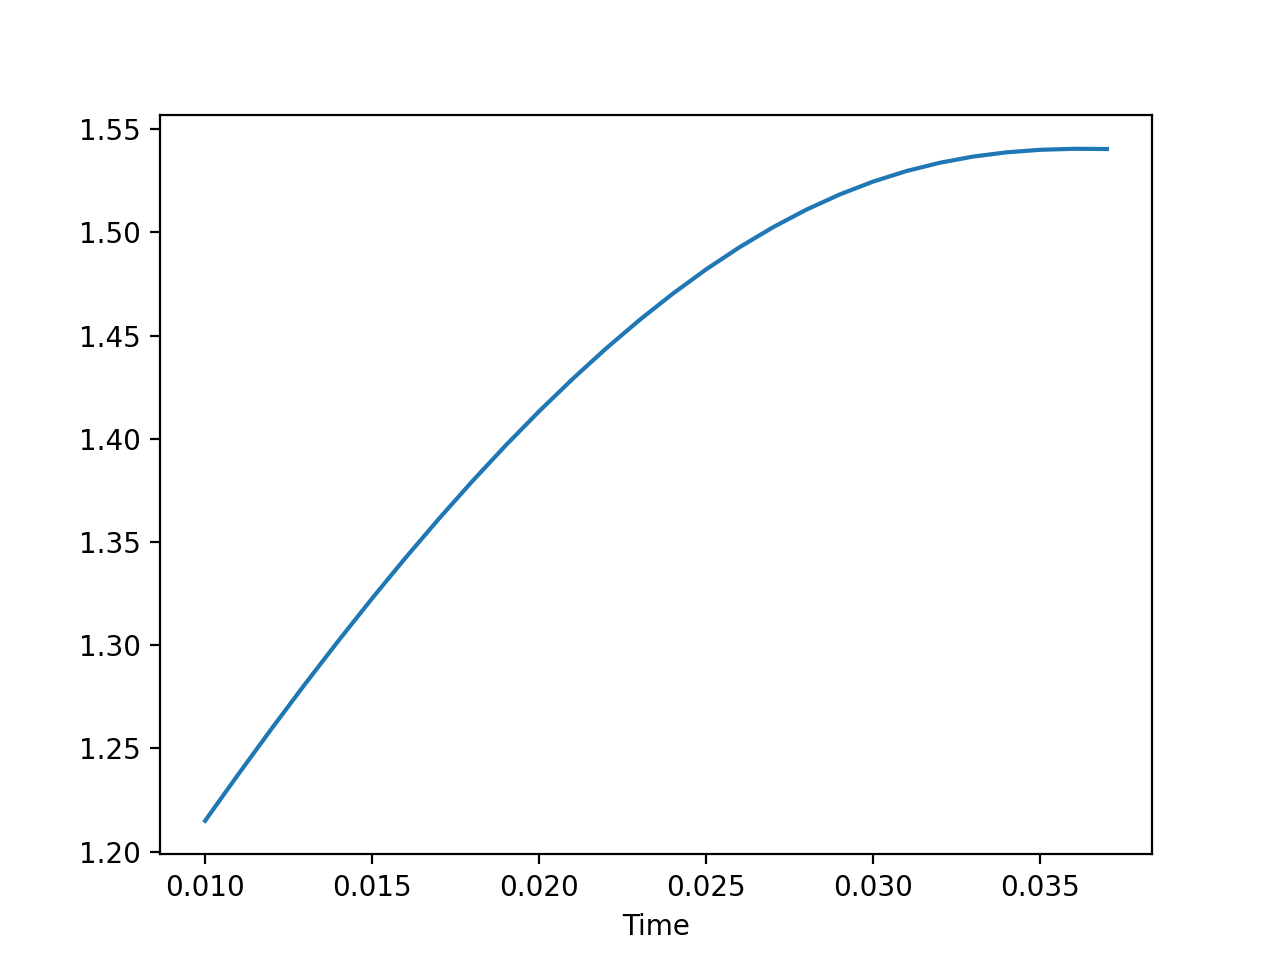
Example
import numpy as np
import pyemgpipeline as pep

# prepare data  # 1 trial  # 1 channel in each trial, shape = (40,)
data = np.array([14.191, 15.106, 7.172, 4.425, 8.698, 12.36, 9.308, 11.749, 9.308, 13.58,
                 9.613, 7.172, 3.51, 8.698, 5.646, 9.003, 6.866, 5.341, 10.223, 10.834,
                 4.12, 5.035, 8.087, 8.087, 6.866, 4.425, -1.068, 3.51, 18.463, 8.392,
                 6.561, 12.97, 12.054, 9.003, 5.035, 6.561, 3.815, 3.204, 5.341, -0.458])
hz = 1000

# initialize EMGMeasurement
m = pep.wrappers.EMGMeasurement(data, hz=hz)

# apply seven processing steps
m.apply_dc_offset_remover()
m.apply_bandpass_filter(bf_order=4, bf_cutoff_fq_lo=5, bf_cutoff_fq_hi=420)
m.apply_full_wave_rectifier()
m.apply_linear_envelope(le_order=4, le_cutoff_fq=8)
m.apply_end_frame_cutter(n_end_frames=2)
m.apply_amplitude_normalizer(max_amplitude=1.5)
m.apply_segmenter(beg_ts=0.01, end_ts=0.04)

# plot final result
m.plot()
(Source code, png, hires.png, pdf)

EMGMeasurementCollection
- class pyemgpipeline.wrappers.EMGMeasurementCollection(all_data, hz, all_timestamp=None, trial_names=None, channel_names=None, emg_plot_params=None)
Wrapper of multiple-trial EMG processing
- Parameters
all_data (list) – Elements of all_data are signal data of the trials. Signal data of each trial should be ndarray of shape (n_samples,) or (n_samples, n_channels), where n_samples > 15 (See Notes). Dimensions and n_channels (if 2-dim) of all trials should be the same.
hz (float) – Sample rate in hertz. Ref [1] suggests that minimum sample rate be at least twice the highest cutoff frequency of the bandpass filter (Nyquist theorem) and preferably higher. Ref [2] suggests a minimum sample rate of 1000 Hz for surface EMG. For fine wire EMG, the authors suggest a minimum sample rate of 2000 Hz.
all_timestamp (list or None, default None) – If list, its length should be the same as the length of all_data and elements are ndarray or None. The ndarray in all_timestamp is the actual timestamp of the corresponding trial, and it should be in 1-dim and have the same length as the first dimension of its corresponding element in all_data.
trial_names (list or None, default None) – Trial names. If not None, trial_names and all_data should have the same length.
channel_names (list or None, default None) – If list, elements are str and its length should be equal to n_channels. Channel names of all trials to be shown in plots.
emg_plot_params (EMGPlotParams or None, default None) – See class EMGPlotParams and function emg_plot.
Notes
n_samples has to meet the length condition for using bandpass filter. With the default parameter in BandpassFilter, n_samples must exceed 15. (See class BandpassFilter, function apply)
References
- [1] Editors (2018).
Standards for reporting EMG data. Journal of Electromyography and Kinesiology, 42, I-II. Doi: 10.1016/S1050-6411(18)30348-1.
- [2] Stegeman, D.F., & Hermens, H.J. (1999).
Standards for surface electromyography: the European project “Surface EMG for non-invasive assessment of muscles (SENIAM)”. Biomed 2 program of the European Community. European concerted action. 108-112.
- __getitem__(k)
Extract data of trial k
- Parameters
k (index of list) – k is an integer between 0 and len(all_data) - 1.
- Returns
m – An EMGMeasurement instance which possesses the data of trial k.
- Return type
- apply_amplitude_normalizer(max_amplitude)
Apply amplitude normalizer to the data
- Parameters
max_amplitude (scalar, list, or ndarray) – One or more positive values. If data in all_data is in 1-dim or n_channels is 1, then max_amplitude should be one value; otherwise max_amplitude should be n_channels values. max_amplitude is the value used as divisor in amplitude normalization for all trials.
- Returns
- Return type
None
- apply_bandpass_filter(bf_order=4, bf_cutoff_fq_lo=10, bf_cutoff_fq_hi=450)
Apply bandpass filter to the data
- Parameters
bf_order (int, default=4) – Effective order (i.e., order after two-directional filtering) of the butterworth filter. bf_order should be a multiple of 2.
bf_cutoff_fq_lo (float, default=10) – Low cutoff frequency of the bandpass filter. See class BandpassFilter.
bf_cutoff_fq_hi (float, default=450) – High cutoff frequency of the bandpass filter. See class BandpassFilter.
- Returns
- Return type
None
- apply_dc_offset_remover()
Apply DC offset remover to the data
- Returns
- Return type
None
- apply_end_frame_cutter(n_end_frames=30)
Apply end frame cutter to the data (signal and timestamp)
- Parameters
n_end_frames (int, default=30) – Number of frames to be cut off in both ends of the signal. n_end_frames >= 0.
- Returns
- Return type
None
- apply_full_wave_rectifier()
Apply full wave rectifier to the data
- Returns
- Return type
None
- apply_linear_envelope(le_order=4, le_cutoff_fq=6)
Apply linear envelope to the data
- Parameters
le_order (int, default=4) – Effective order (i.e., order after two-directional filtering) of the butterworth filter for linear envelope. le_order should be a multiple of 2.
le_cutoff_fq (float, default=6) – Cutoff frequency of the lowpass filter. See class LinearEnvelope.
- Returns
- Return type
None
- apply_segmenter(all_beg_ts, all_end_ts)
Apply segmenter to the data (signal and timestamp)
- Parameters
all_beg_ts (list) – Elements of all_beg_ts are float and the length should be equal to the length of all_data. Beginning time of interest for each trial. For trial k, all_beg_ts[k] <= all_timestamp[k][-1].
all_end_ts (list) – Elements of all_end_ts are float and the length should be equal to the length of all_data. End time of interest for each trial. For trial k, all_end_ts[k] >= all_timestamp[k][0] and all_beg_ts[k] < all_end_ts[k].
- Returns
- Return type
None
- export_csv(all_csv_path)
Export the processing results of all trials to csv
- Parameters
all_csv_path (list) – The length of all_csv_path should be the same as the length of all_data. The destination paths to export data of all trials.
- Returns
- Return type
None
- find_max_amplitude_of_each_channel_across_trials()
Find max amplitude of each channel across trials
- Returns
max_amplitude – Shape (n_channels,). Max amplitude of each channel which is found across all trials.
- Return type
ndarray
- plot(k_for_plot=None, is_overlapping_trials=False, main_title=None, cycled_colors=None, is_hide_legend=False, legend_kwargs=None, axes_pos_adjust=None)
Plot all trials
- Parameters
k_for_plot (integer, list of integer, or None) – If integer, k_for_plot is an index of the list self.c.all_data. If list of integer, k_for_plot is a list of selected indices of the list self.c.all_data. If None, k_for_plot will be a list of all indices of the list self.c.all_data. k_for_plot sets which trials of the data to be plotted.
is_overlapping_trials (bool, default False) – Whether or not to plot trials of the same channel overlappingly on one (sub)figure.
main_title (str or None, default None) – main_title is used when is_overlapping_trials is True. The main title of the plot.
cycled_colors (list or None, default None) – cycled_colors is used when is_overlapping_trials is True. The colors for plotting overlapped trials data.
is_hide_legend (bool, default False) – Whether or not to hide legend.
legend_kwargs (dict or None, default None) – legend_kwargs is used when is_overlapping_trials is True. Parameters to control the legend display. They are the “other parameters” of method matplotlib.axes.Axes.legend, including loc, bbox_to_anchor, ncol, prop, fontsize, etc. (See https://matplotlib.org/stable/api/_as_gen/matplotlib.axes.Axes.legend.html).
axes_pos_adjust (4-tuple or None, default None) – axes_pos_adjust is used when is_overlapping_trials is True. Parameters to adjust the axes position (i.e., plot position) when legend is displayed to prevent legend overlaying the plot. The 4-tuple represents: [0] shift of left position relative to width, [1] shift of bottom position relative to height, [2] proportion of width, [3] proportion of height. If None, no adjustment is applied, i.e., the value (0, 0, 1, 1) is applied.
- Returns
- Return type
None
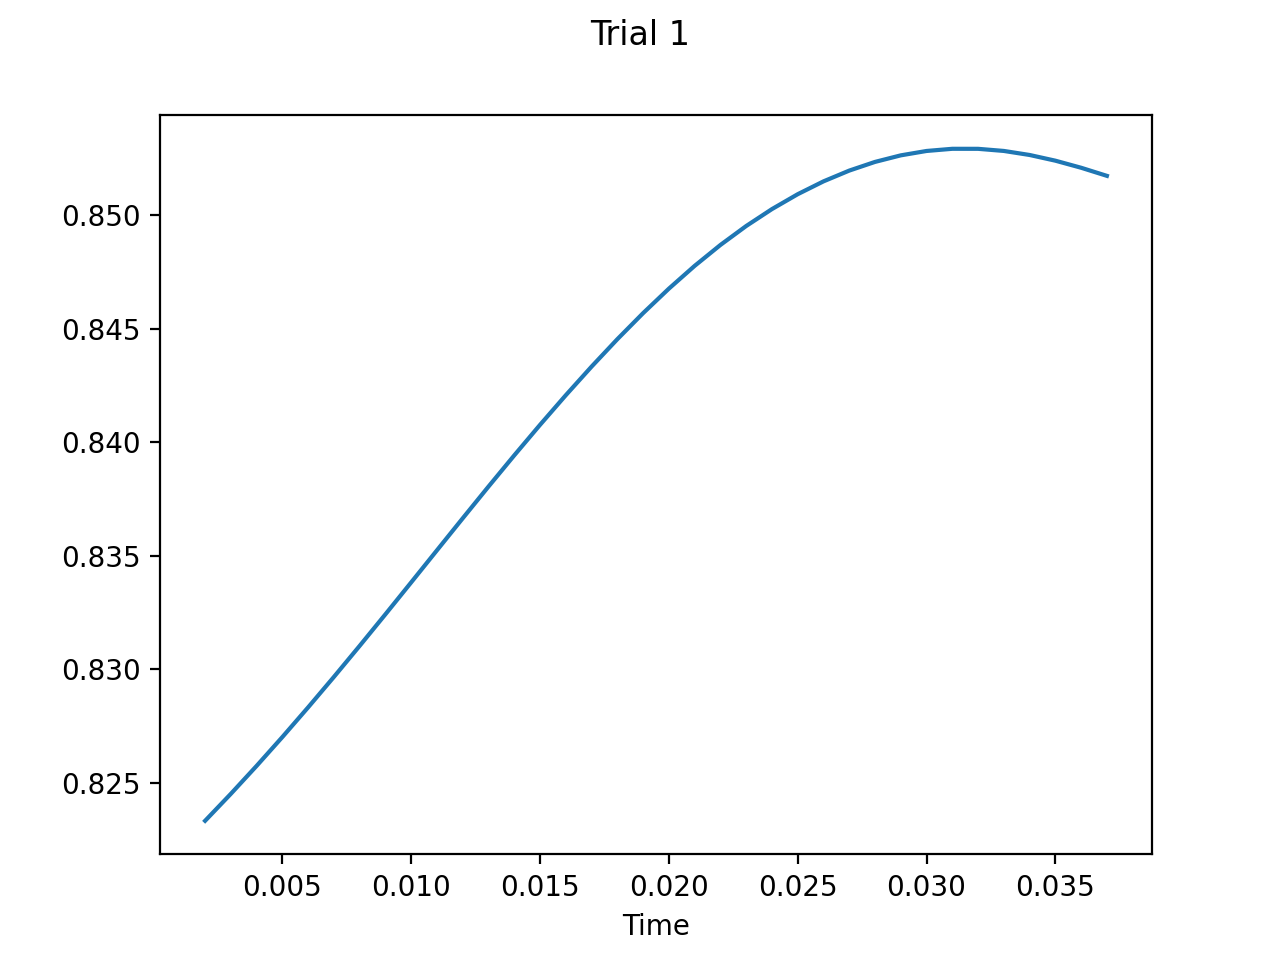
Example
import numpy as np
import pyemgpipeline as pep

# prepare data  # 2 trials  # 1 channel in each trial, shape = (40,)
all_data = [np.array([-5.646, 12.665, 16.937, 1.678, -27.008, -15.411, -3.51, 11.139,
                      10.529, 1.068, -2.289, 1.984, -26.703, -54.475, -61.799, -37.385,
                      -17.242, -0.763, 19.073, 49.897, 62.104, 69.734, 60.884, 67.597,
                      35.554, 7.477, 8.087, 2.594, -12.054, 16.327, 55.696, 85.298,
                      84.992, 28.534, 23.041, 45.625, 49.897, 6.256, -57.221, -62.409]),
            np.array([-3.815, -1.068, -3.51, 0.153, 7.477, 5.341, 19.989, 12.665,
                      5.341, 0.153, 3.204, 12.97, 4.73, 12.665, 8.087, 14.191,
                      12.36, 14.496, 8.087, 14.191, 3.815, 4.12, -0.763, 2.289,
                      -4.12, -7.477, -10.529, -5.035, 6.866, 9.308, 2.594, 11.749,
                      1.984, -6.256, -5.951, -7.477, -8.392, -7.172, -5.646, -5.646])]
hz = 1000

# initialize EMGMeasurementCollection
c = pep.wrappers.EMGMeasurementCollection(all_data, hz=hz, trial_names=['Trial 1', 'Trial 2'])

# apply seven processing steps
c.apply_dc_offset_remover()
c.apply_bandpass_filter(bf_order=4, bf_cutoff_fq_lo=10, bf_cutoff_fq_hi=450)
c.apply_full_wave_rectifier()
c.apply_linear_envelope(le_order=4, le_cutoff_fq=6)
c.apply_end_frame_cutter(n_end_frames=2)
c.apply_amplitude_normalizer(max_amplitude=38.3)
c.apply_segmenter(all_beg_ts=[0, 0], all_end_ts=[999, 999])

# plot final result
c.plot()
